 Stefan Bruckner
Professor, Chair of Visual Analytics, University of Rostock, Germany.

I am a visualization researcher and professor at the University of Rostock, where I am director of the Institute for Visual and Analytic Computing and head the Chair of Visual Analytics. Previously, I was professor of visualization at the Department of Informatics of the University of Bergen in Norway. I investigate methods for gaining insight into complex data to further scientific understanding and discovery, medical diagnosis and treatment, and engineering, as well as techniques for communicating these findings to the public. Building on these foundations, my current interests include the development of novel interactive approaches for the inquiry of large-scale heterogeneous data spaces in data-driven science.
Before my professorial appointment in Bergen in 2013, I was an assistant professor at the TU Wien, Austria where I also received my Ph.D. in Computer Science in 2008 and was awarded habilitation degree (venia docendi) in Practical Computer Science in 2012.
I have co-authored over 100 research papers on a variety of topics in visual computing including work on areas such as illustrative visualization, volume rendering, smart visual interfaces, biomedical data visualization, and visual parameter space exploration.
I am the speaker of the German Informatics Society Work Group on Visual Computing in Biology in Medicine and a member of the Eurographics Executive Committee. I am an associate editor of the journals IEEE Transactions on Visualization and Computers & Graphics. I was also paper co-chair of EuroVis, PacificVis, the Eurographics Workshop on Visual Computing for Biology and Medicine, and the Eurographics Medical Prize. I am a member of ACM SIGGRAPH, Eurographics, the IEEE Computer Society, and German Informatics Society.
selected publications
-
 Towards Understanding Decision Problems As a Goal of Visualization DesignLena Cibulski, and Stefan BrucknerIn Proceedings of IEEE VIS (Short Papers), 2025Best Short Paper Honorable Mention at IEEE VIS 2025
Decision-making is a central yet under-defined goal in visualization research. While existing task models address decision processes, they often neglect the conditions framing a decision. To better support decision-making tasks, we propose a characterization scheme that describes decision problems through key properties of the data, users, and task context. This scheme helps visualization researchers specify decision-support claims more precisely and informs the design of appropriate visual encodings and interactions. We demonstrate the utility of our approach by applying it to characterize decision tasks targeted by existing design studies, highlighting opportunities for future research in decision-centric visualization.
@inproceedings{Cibulski-2025-TUD, author = {Cibulski, Lena and Bruckner, Stefan}, title = {Towards Understanding Decision Problems As a Goal of Visualization Design}, booktitle = {Proceedings of IEEE VIS (Short Papers)}, year = {2025}, pages = {266--270}, doi = {10.1109/VIS60296.2025.00059}, keywords = {decision making, visualization, task characterization}, note = {Best Short Paper Honorable Mention at IEEE VIS 2025}, } -
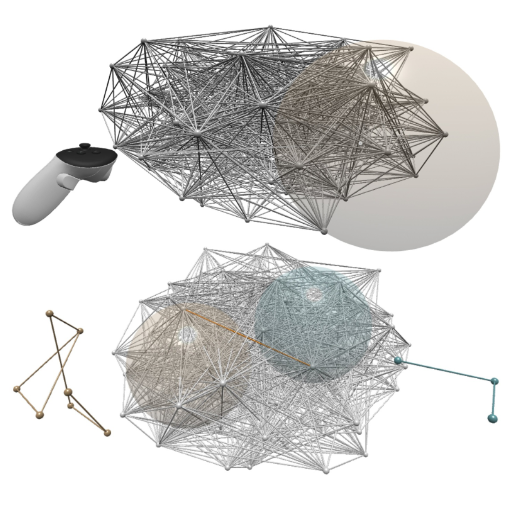 Multi-Focus Probes for Context-Preserving Network Exploration and Interaction in Immersive AnalyticsEric Zimmermann, and Stefan BrucknerIn Proceedings of IEEE VIS (Short Papers), 2025
Immersive visualization of network data enables users to physically navigate and interact with complex structures, but managing transitions between detailed local (egocentric) views and global (exo-centric) overviews remains a major challenge. We present a multi-focus probe technique for immersive environments that allows users to instantiate multiple egocentric subgraph views while maintaining persistent links to the global network context. Each probe acts as a portable local focus, enabling fine-grained inspection and editing of distant or occluded regions. Visual and haptic guidance mechanisms ensure context preservation during multi-scale interaction. We demonstrate and discuss the usability of our technique for the editing of network data.
@inproceedings{Zimmermann-2025-MPC, author = {Zimmermann, Eric and Bruckner, Stefan}, title = {Multi-Focus Probes for Context-Preserving Network Exploration and Interaction in Immersive Analytics}, booktitle = {Proceedings of IEEE VIS (Short Papers)}, year = {2025}, pages = {346--350}, doi = {10.1109/VIS60296.2025.00075}, keywords = {navigation, deformation, immersive visualization, network data}, } -
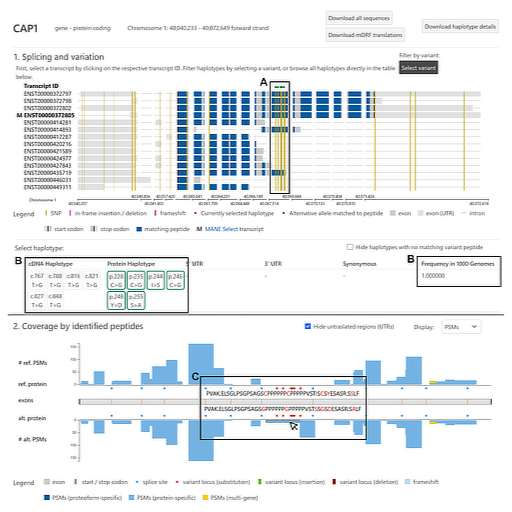 ProHap Explorer: Visualizing Haplotypes in Proteogenomic DatasetsJakub Vašíček, Dafni Skiadopoulou, Ksenia G. Kuznetsova, Lukas Käll, Marc Vaudel, and Stefan BrucknerIEEE Computer Graphics and Applications, 2025
In mass spectrometry-based proteomics, experts usually project data onto a single set of reference sequences, overlooking the influence of common haplotypes (combinations of genetic variants inherited together from a parent). We recently introduced ProHap, a tool for generating customized protein haplotype databases. Here, we present ProHap Explorer, a visualization interface designed to investigate the influence of common haplotypes on the human proteome. It enables users to explore haplotypes, their effects on protein sequences, and the identification of non-canonical peptides in public mass spectrometry datasets. The design builds on well-established representations in biological sequence analysis, ensuring familiarity for domain experts while integrating novel interactive elements tailored to proteogenomic data exploration. User interviews with proteomics experts confirmed the tool’s utility, highlighting its ability to reveal whether haplotypes affect proteins of interest. By facilitating the intuitive exploration of proteogenomic variation, ProHap Explorer supports research in personalized medicine and the development of targeted therapies.
@article{Vasicek-2025-PEV, author = {Vašíček, Jakub and Skiadopoulou, Dafni and Kuznetsova, Ksenia G. and Käll, Lukas and Vaudel, Marc and Bruckner, Stefan}, journal = {IEEE Computer Graphics and Applications}, title = {ProHap Explorer: Visualizing Haplotypes in Proteogenomic Datasets}, year = {2025}, number = {5}, pages = {64--77}, volume = {45}, doi = {10.1109/MCG.2025.3581736}, keywords = {haplotypes, proteomics, bioinformatics, data visualization}, } -
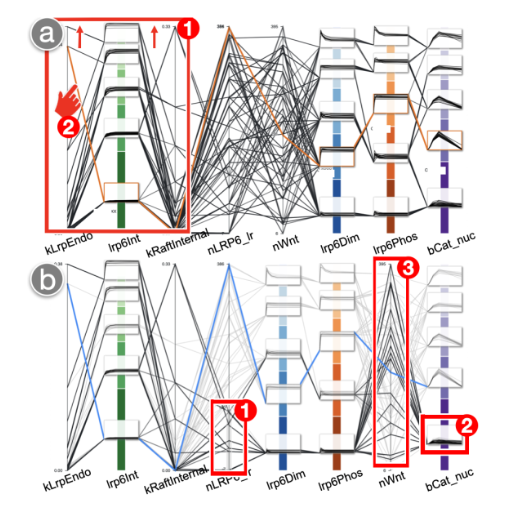 Visual Analysis of Time-Dependent Observables in Cell Signaling SimulationsLena Cibulski, Fiete Haack, Adelinde Uhrmacher, and Stefan BrucknerIn Proceedings of VCBM (Short Papers), 2025Best Short Paper Award at VCBM 2025
The ability of a cell to communicate with its environment is essential for key cellular functions like replication, metabolism, or cell fate decisions. The involved molecular mechanisms are highly dynamic and difficult to capture experimentally. Simulation studies offer a valuable means for exploring and predicting how cell signaling processes unfold. We present a design study on the visual analysis of such studies to support 1) modelers in calibrating model parameters such that the simulated signal responses over time reflect reference behavior from cell biology research and 2) cell biologists in exploring the influence of receptor trafficking on the efficiency of signal transmission within the cell. We embed time series plots into parallel coordinates to enable a simultaneous analysis of model parameters and temporal outputs. A usage scenario illustrates how our approach assists with typical tasks such as assessing the plausibility of temporal outputs or their sensitivity across model configurations.
@inproceedings{Cibulski-2025-VAT, author = {Cibulski, Lena and Haack, Fiete and Uhrmacher, Adelinde and Bruckner, Stefan}, title = {Visual Analysis of Time-Dependent Observables in Cell Signaling Simulations}, booktitle = {Proceedings of VCBM (Short Papers)}, year = {2025}, doi = {10.2312/vcbm.20251252}, keywords = {visual analytics, cell signaling, simulation, parallel coordinates}, note = {Best Short Paper Award at VCBM 2025}, } -
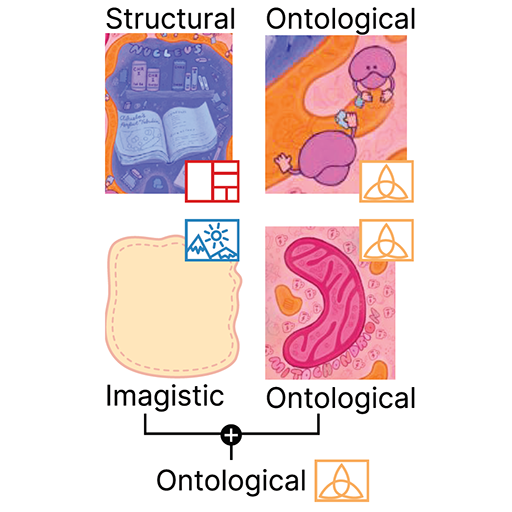 The Language of Infographics: Toward Understanding Conceptual Metaphor Use in Scientific StorytellingHana Pokojná, Tobias Isenberg, Stefan Bruckner, Barbora Kozlíková, and Laura GarrisonIEEE Transactions on Visualization and Computer Graphics, 2025
We apply an approach from cognitive linguistics by mapping Conceptual Metaphor Theory (CMT) to the visualization domain to address patterns of visual conceptual metaphors that are often used in science infographics. Metaphors play an essential part in visual communication and are frequently employed to explain complex concepts. However, their use is often based on intuition, rather than following a formal process. At present, we lack tools and language for understanding and describing metaphor use in visualization to the extent where taxonomy and grammar could guide the creation of visual components, e.g., infographics. Our classification of the visual conceptual mappings within scientific representations is based on the breakdown of visual components in existing scientific infographics. We demonstrate the development of this mapping through a detailed analysis of data collected from four domains (biomedicine, climate, space, and anthropology) that represent a diverse range of visual conceptual metaphors used in the visual communication of science. This work allows us to identify patterns of visual conceptual metaphor use within the domains, resolve ambiguities about why specific conceptual metaphors are used, and develop a better overall understanding of visual metaphor use in scientific infographics. Our analysis shows that ontological and orientational conceptual metaphors are the most widely applied to translate complex scientific concepts. To support our findings we developed a visual exploratory tool based on the collected database that places the individual infographics on a spatio-temporal scale and illustrates the breakdown of visual conceptual metaphors.
@article{Pokojna-2025-LIT, author = {Pokojná, Hana and Isenberg, Tobias and Bruckner, Stefan and Kozlíková, Barbora and Garrison, Laura}, journal = {IEEE Transactions on Visualization and Computer Graphics}, title = {The Language of Infographics: Toward Understanding Conceptual Metaphor Use in Scientific Storytelling}, year = {2025}, number = {1}, pages = {371--381}, volume = {31}, doi = {10.1109/TVCG.2024.3456327}, keywords = {infographics, visual communication, linguistics}, } -
 Current Approaches in Narrative Medical VisualizationLaura Ann Garrison, Monique Meuschke, Bernhard Preim, and Stefan BrucknerIn Approaches for Science Illustration and Communication, 2023
In a world increasingly driven by data and technology, it is imperative to empower stakeholders across diverse backgrounds (scientists, policymakers, patients, the general public) to make informed decisions about their health with the information available. However, simply providing the information is often not enough. The key to sharing and communicating health and medicine is making the information relevant to the intended audience. This issue lies at the heart of effective science communication. Storytelling is an age-old practice, and arguably one of the most defining features of humanity. Stories enable science communicators to translate complex information from health and medicine into a narrative that is personally accessible and relevant to the individual. Many pieces come together to craft what many would call a "good story"–one of these is narrative. Our work seeks to tease out the role of narrative, with its various components, in telling medical stories. This chapter discusses current approaches in narrative medical visualization, with an eye toward future opportunities in developing narratives for data-driven medical stories. We explore various strategies in narrative structure and character that may be unique to telling medical stories and provide an outlook on future directions in this space.
@incollection{Garrison-2023-CAN, author = {Garrison, Laura Ann and Meuschke, Monique and Preim, Bernhard and Bruckner, Stefan}, booktitle = {Approaches for Science Illustration and Communication}, publisher = {Springer}, title = {Current Approaches in Narrative Medical Visualization}, year = {2023}, chapter = {4}, doi = {10.1007/978-3-031-41652-1_4}, pages = {95--116}, } -
 Semantic Snapping for Guided Multi-View Visualization DesignYngve Sekse Kristiansen, Laura Garrison, and Stefan BrucknerIEEE Transactions on Visualization and Computer Graphics, Jan 2022
Visual information displays are typically composed of multiple visualizations that are used to facilitate an understanding of the underlying data. A common example are dashboards, which are frequently used in domains such as finance, process monitoring and business intelligence. However, users may not be aware of existing guidelines and lack expert design knowledge when composing such multi-view visualizations. In this paper, we present semantic snapping, an approach to help non-expert users design effective multi-view visualizations from sets of pre-existing views. When a particular view is placed on a canvas, it is “aligned” with the remaining views–not with respect to its geometric layout, but based on aspects of the visual encoding itself, such as how data dimensions are mapped to channels. Our method uses an on-the-fly procedure to detect and suggest resolutions for conflicting, misleading, or ambiguous designs, as well as to provide suggestions for alternative presentations. With this approach, users can be guided to avoid common pitfalls encountered when composing visualizations. Our provided examples and case studies demonstrate the usefulness and validity of our approach.
@article{Kristiansen-2022-SSG, author = {Kristiansen, Yngve Sekse and Garrison, Laura and Bruckner, Stefan}, journal = {IEEE Transactions on Visualization and Computer Graphics}, title = {Semantic Snapping for Guided Multi-View Visualization Design}, year = {2022}, month = jan, pages = {43--53}, volume = {28}, doi = {10.1109/TVCG.2021.3114860}, keywords = {tabular data, guidelines, mixed initiative human-machine analysis, coordinated and multiple views}, project = {MetaVis,VIDI}, vid = {Kristiansen-2021-SSG.mp4}, } -
 SplitStreams: A Visual Metaphor for Evolving HierarchiesFabian Bolte, Mahsan Nourani, Eric Ragan, and Stefan BrucknerIEEE Transactions on Visualization and Computer Graphics, Aug 2021
The visualization of hierarchically structured data over time is an ongoing challenge and several approaches exist trying to solve it. Techniques such as animated or juxtaposed tree visualizations are not capable of providing a good overview of the time series and lack expressiveness in conveying changes over time. Nested streamgraphs provide a better understanding of the data evolution, but lack the clear outline of hierarchical structures at a given timestep. Furthermore, these approaches are often limited to static hierarchies or exclude complex hierarchical changes in the data, limiting their use cases. We propose a novel visual metaphor capable of providing a static overview of all hierarchical changes over time, as well as clearly outlining the hierarchical structure at each individual time step. Our method allows for smooth transitions between tree maps and nested streamgraphs, enabling the exploration of the trade-off between dynamic behavior and hierarchical structure. As our technique handles topological changes of all types, it is suitable for a wide range of applications. We demonstrate the utility of our method on several use cases, evaluate it with a user study, and provide its full source code.
@article{Bolte-2021-SVM, author = {Bolte, Fabian and Nourani, Mahsan and Ragan, Eric and Bruckner, Stefan}, journal = {IEEE Transactions on Visualization and Computer Graphics}, title = {SplitStreams: A Visual Metaphor for Evolving Hierarchies}, year = {2021}, month = aug, doi = {10.1109/TVCG.2020.2973564}, keywords = {Information Visualization, Trees, Data Structures and Data Types, Visualization Techniques and Methodologies}, project = {MetaVis}, url = {https://arxiv.org/pdf/2002.03891.pdf}, } -
 DimLift: Interactive Hierarchical Data Exploration through Dimensional BundlingLaura Garrison, Juliane Müller, Stefanie Schreiber, Steffen Oeltze-Jafra, Helwig Hauser, and Stefan BrucknerIEEE Transactions on Visualization and Computer Graphics, Jun 2021
The identification of interesting patterns and relationships is essential to exploratory data analysis. This becomes increasingly difficult in high dimensional datasets. While dimensionality reduction techniques can be utilized to reduce the analysis space, these may unintentionally bury key dimensions within a larger grouping and obfuscate meaningful patterns. With this work we introduce DimLift, a novel visual analysis method for creating and interacting with dimensional bundles. Generated through an iterative dimensionality reduction or user-driven approach, dimensional bundles are expressive groups of dimensions that contribute similarly to the variance of a dataset. Interactive exploration and reconstruction methods via a layered parallel coordinates plot allow users to lift interesting and subtle relationships to the surface, even in complex scenarios of missing and mixed data types. We exemplify the power of this technique in an expert case study on clinical cohort data alongside two additional case examples from nutrition and ecology.
@article{Garrison-2021-DIH, author = {Garrison, Laura and M\"{u}ller, Juliane and Schreiber, Stefanie and Oeltze-Jafra, Steffen and Hauser, Helwig and Bruckner, Stefan}, journal = {IEEE Transactions on Visualization and Computer Graphics}, title = {DimLift: Interactive Hierarchical Data Exploration through Dimensional Bundling}, year = {2021}, month = jun, number = {6}, pages = {2908--2922}, volume = {27}, doi = {10.1109/TVCG.2021.3057519}, project = {VIDI}, } -
 Line Weaver: Importance-Driven Order Enhanced Rendering of Dense Line ChartsThomas Trautner, and Stefan BrucknerComputer Graphics Forum, Jun 2021
Line charts are an effective and widely used technique for visualizing series of ordered two-dimensional data points. The relationship between consecutive points is indicated by connecting line segments, revealing potential trends or clusters in the underlying data. However, when dealing with an increasing number of lines, the render order substantially influences the resulting visualization. Rendering transparent lines can help but unfortunately the blending order is currently either ignored or naively used, for example, assuming it is implicitly given by the order in which the data was saved in a file. Due to the noncommutativity of classic alpha blending, this results in contradicting visualizations of the same underlying data set, so-called "hallucinators". In this paper, we therefore present line weaver, a novel visualization technique for dense line charts. Using an importance function, we developed an approach that correctly considers the blending order independently of the render order and without any prior sorting of the data. We allow for importance functions which are either explicitly given or implicitly derived from the geometric properties of the data if no external data is available. The importance can then be applied globally to entire lines, or locally per pixel which simultaneously supports various types of user interaction. Finally, we discuss the potential of our contribution based on different synthetic and real-world data sets where classic or naive approaches would fail.
@article{Trautner-2021-LWI, author = {Trautner, Thomas and Bruckner, Stefan}, journal = {Computer Graphics Forum}, title = {Line Weaver: Importance-Driven Order Enhanced Rendering of Dense Line Charts}, year = {2021}, month = jun, number = {3}, pages = {399--410}, volume = {40}, doi = {10.1111/cgf.14316}, keywords = {information visualization, visualization techniques, line charts}, project = {MetaVis}, } -
 Sunspot Plots: Model-based Structure Enhancement for Dense Scatter PlotsThomas Trautner, Fabian Bolte, Sergej Stoppel, and Stefan BrucknerComputer Graphics Forum, May 2020
Scatter plots are a powerful and well-established technique for visualizing the relationships between two variables as a collection of discrete points. However, especially when dealing with large and dense data, scatter plots often exhibit problems such as overplotting, making the data interpretation arduous. Density plots are able to overcome these limitations in highly populated regions, but fail to provide accurate information of individual data points. This is particularly problematic in sparse regions where the density estimate may not provide a good representation of the underlying data. In this paper, we present sunspot plots, a visualization technique that communicates dense data as a continuous data distribution, while preserving the discrete nature of data samples in sparsely populated areas. We furthermore demonstrate the advantages of our approach on typical failure cases of scatter plots within synthetic and real-world data sets and validate its effectiveness in a user study.
@article{Trautner-2020-SPM, author = {Trautner, Thomas and Bolte, Fabian and Stoppel, Sergej and Bruckner, Stefan}, journal = {Computer Graphics Forum}, title = {Sunspot Plots: Model-based Structure Enhancement for Dense Scatter Plots}, year = {2020}, month = may, number = {3}, pages = {551--563}, volume = {39}, doi = {10.1111/cgf.14001}, keywords = {information visualization, scatterplots, kernel density estimation}, project = {MetaVis}, vid = {vids/Trautner_2020_SunspotPlots_video.mp4}, } -
 A Model of Spatial Directness in Interactive VisualizationStefan Bruckner, Tobias Isenberg, Timo Ropinski, and Alexander WiebelIEEE Transactions on Visualization and Computer Graphics, Aug 2019
We discuss the concept of directness in the context of spatial interaction with visualization. In particular, we propose a model that allows practitioners to analyze and describe the spatial directness of interaction techniques, ultimately to be able to better understandinteraction issues that may affect usability. To reach these goals, we distinguish between different types of directness. Each type of directness depends on a particular mapping between different spaces, for which we consider the data space, the visualization space, the output space, the user space, the manipulation space, and the interaction space. In addition to the introduction of the model itself, we alsoshow how to apply it to several real-world interaction scenarios in visualization, and thus discuss the resulting types of spatial directness,without recommending either more direct or more indirect interaction techniques. In particular, we will demonstrate descriptive and evaluative usage of the proposed model, and also briefly discuss its generative usage.
@article{Bruckner-2018-MSD, author = {Bruckner, Stefan and Isenberg, Tobias and Ropinski, Timo and Wiebel, Alexander}, journal = {IEEE Transactions on Visualization and Computer Graphics}, title = {A Model of Spatial Directness in Interactive Visualization}, year = {2019}, month = aug, number = {8}, volume = {25}, doi = {10.1109/TVCG.2018.2848906}, project = {MetaVis}, } -
 Dynamic Visibility-Driven Molecular SurfacesStefan BrucknerComputer Graphics Forum, May 2019
Molecular surface representations are an important tool for the visual analysis of molecular structure and function. In this paper, we present a novel method for the visualization of dynamic molecular surfaces based on the Gaussian model. In contrast to previous approaches, our technique does not rely on the construction of intermediate representations such as grids or triangulated surfaces. Instead, it operates entirely in image space, which enables us to exploit visibility information to efficiently skip unnecessary computations. With this visibility-driven approach, we can visualize dynamic high-quality surfaces for molecules consisting of millions of atoms. Our approach requires no preprocessing, allows for the interactive adjustment of all properties and parameters, and is significantly faster than previous approaches, while providing superior quality.
@article{Bruckner-2019-DVM, author = {Bruckner, Stefan}, journal = {Computer Graphics Forum}, title = {Dynamic Visibility-Driven Molecular Surfaces}, year = {2019}, month = may, number = {2}, pages = {317--329}, volume = {38}, doi = {10.1111/cgf.13640}, project = {MetaVis}, publisher = {The Eurographics Association and John Wiley and Sons Ltd.}, } -
 Firefly: Virtual Illumination Drones for Interactive VisualizationSergej Stoppel, Magnus Paulson Erga, and Stefan BrucknerIEEE Transactions on Visualization and Computer Graphics, Jan 2019Best SciVis Paper Honorable Mention at VIS 2018
Light specification in three dimensional scenes is a complex problem and several approaches have been presented that aim to automate this process. However, there are many scenarios where a static light setup is insufficient, as the scene content and camera position may change. Simultaneous manual control over the camera and light position imposes a high cognitive load on the user. To address this challenge, we introduce a novel approach for automatic scene illumination with Fireflies. Fireflies are intelligent virtual light drones that illuminate the scene by traveling on a closed path. The Firefly path automatically adapts to changes in the scene based on an outcome-oriented energy function. To achieve interactive performance, we employ a parallel rendering pipeline for the light path evaluations. We provide a catalog of energy functions for various application scenarios and discuss the applicability of our method on several examples.
@article{Stoppel-2019-FVI, author = {Stoppel, Sergej and Erga, Magnus Paulson and Bruckner, Stefan}, journal = {IEEE Transactions on Visualization and Computer Graphics}, title = {Firefly: Virtual Illumination Drones for Interactive Visualization}, year = {2019}, month = jan, note = {Best SciVis Paper Honorable Mention at VIS 2018}, pages = {1204--1213}, volume = {25}, doi = {10.1109/TVCG.2018.2864656}, project = {MetaVis}, vid = {vids/FinalVideo.mp4}, } -
 Interactive Dynamic Volume Illumination with Refraction and CausticsJens G. Magnus, and Stefan BrucknerIEEE Transactions on Visualization and Computer Graphics, Phoenix, USA, Jan 2018
In recent years, significant progress has been made in developing high-quality interactive methods for realistic volume illumination. However, refraction – despite being an important aspect of light propagation in participating media – has so far only received little attention. In this paper, we present a novel approach for refractive volume illumination including caustics capable of interactive frame rates. By interleaving light and viewing ray propagation, our technique avoids memory-intensive storage of illumination information and does not require any precomputation. It is fully dynamic and all parameters such as light position and transfer function can be modified interactively without a performance penalty.
@article{Magnus-2018-VPI, author = {Magnus, Jens G. and Bruckner, Stefan}, journal = {IEEE Transactions on Visualization and Computer Graphics}, title = {Interactive Dynamic Volume Illumination with Refraction and Caustics}, year = {2018}, month = jan, number = {1}, pages = {984--993}, volume = {24}, doi = {10.1109/TVCG.2017.2744438}, event = {IEEE SciVis 2017}, keywords = {interactive volume rendering, illumination, refraction, shadows, caustics}, location = {Phoenix, USA}, project = {MetaVis}, } -
 Albero: A Visual Analytics Approach for Probabilistic Weather ForecastingAlexandra Diehl, Leandro Pelorosso, Kresimir Matkovic, Juan Ruiz, Meister Eduard Gröller, and Stefan BrucknerComputer Graphics Forum, Oct 2017
Probabilistic weather forecasts are amongst the most popular ways to quantify numerical forecast uncertainties. The analog regression method can quantify uncertainties and express them as probabilities. The method comprises the analysis of errors from a large database of past forecasts generated with a specific numerical model and observational data. Current visualization tools based on this method are essentially automated and provide limited analysis capabilities. In this paper, we propose a novel approach that breaks down the automatic process using the experience and knowledge of the users and creates a new interactive visual workflow. Our approach allows forecasters to study probabilistic forecasts, their inner analogs and observations, their associated spatial errors, and additional statistical information by means of coordinated and linked views. We designed the presented solution following a participatory methodology together with domain experts. Several meteorologists with different backgrounds validated the approach. Two case studies illustrate the capabilities of our solution. It successfully facilitates the analysis of uncertainty and systematic model biases for improved decision-making and process-quality measurements.
@article{Diehl-2017-AVA, author = {Diehl, Alexandra and Pelorosso, Leandro and Matkovic, Kresimir and Ruiz, Juan and Gr{\"o}ller, Meister Eduard and Bruckner, Stefan}, journal = {Computer Graphics Forum}, title = {Albero: A Visual Analytics Approach for Probabilistic Weather Forecasting}, year = {2017}, month = oct, number = {7}, pages = {135--144}, volume = {36}, doi = {10.1111/cgf.13279}, keywords = {visual analytics, weather forecasting, uncertainty}, project = {MetaVis}, } -
 Output-Sensitive Filtering of Streaming Volume DataVeronika Šoltészová, Åsmund Birkeland, Sergej Stoppel, Ivan Viola, and Stefan BrucknerComputer Graphics Forum, Jan 2017
Real-time volume data acquisition poses substantial challenges for the traditional visualization pipeline where data enhancement is typically seen as a pre-processing step. In the case of 4D ultrasound data, for instance, costly processing operations to reduce noise and to remove artifacts need to be executed for every frame. To enable the use of high quality filtering operations in such scenarios, we propose an output-sensitive approach to the visualization of streaming volume data. Our method evaluates the potential contribution of all voxels to the final image, allowing us to skip expensive processing operations that have little or no effect on the visualization. As filtering operations modify the data values which may affect the visibility, our main contribution is a fast scheme to predict their maximum effect on the final image. Our approach prioritizes filtering of voxels with high contribution to the final visualization based on a maximal permissible error per pixel. With zero permissible error, the optimized filtering will yield a result identical to filtering of the entire volume. We provide a thorough technical evaluation of the approach and demonstrate it on several typical scenarios that require on-the-fly processing.
@article{Solteszova-2017-OFS, author = {\v{S}olt{\'e}szov{\'a}, Veronika and Birkeland, {\AA}smund and Stoppel, Sergej and Viola, Ivan and Bruckner, Stefan}, journal = {Computer Graphics Forum}, title = {Output-Sensitive Filtering of Streaming Volume Data}, year = {2017}, month = jan, number = {1}, pages = {249--262}, volume = {36}, doi = {10.1111/cgf.12799}, keywords = {output-sensitive processing, volume data, filtering}, } -
 Vol2velle: Printable Interactive Volume VisualizationSergej Stoppel, and Stefan BrucknerIEEE Transactions on Visualization and Computer Graphics, Baltimore, USA, Jan 2017
Interaction is an indispensable aspect of data visualization. The presentation of volumetric data, in particular, often significantly benefits from interactive manipulation of parameters such as transfer functions, rendering styles, or clipping planes. However, when we want to create hardcopies of such visualizations, this essential aspect is lost. In this paper, we present a novel approach for creating hardcopies of volume visualizations which preserves a certain degree of interactivity. We present a method for automatically generating Volvelles, printable tangible wheel charts that can be manipulated to explore different parameter settings. Our interactive system allows the flexible mapping of arbitrary visualization parameters and supports advanced features such as linked views. The resulting designs can be easily reproduced using a standard printer and assembled within a few minutes.
@article{Stoppel-2017-VPI, author = {Stoppel, Sergej and Bruckner, Stefan}, title = {Vol<sup>2</sup>velle: Printable Interactive Volume Visualization}, journal = {IEEE Transactions on Visualization and Computer Graphics}, year = {2017}, volume = {23}, number = {1}, pages = {861--870}, month = jan, doi = {10.1109/TVCG.2016.2599211}, event = {IEEE SciVis 2016}, keywords = {physical visualization, interaction, volume visualization, illustrative visualization}, location = {Baltimore, USA}, } -
 Visual Analysis of Spatio-Temporal Data: Applications in Weather ForecastingAlexandra Diehl, Leandro Pelorosso, Claudio Delrieux, Celeste Saulo, Juan Ruiz, Meister Eduard Gröller, and Stefan BrucknerComputer Graphics Forum, Cagliari, Italy, May 2015
Weather conditions affect multiple aspects of human life such as economy, safety, security, and social activities. For this reason, weather forecast plays a major role in society. Currently weather forecasts are based on Numerical Weather Prediction (NWP) models that generate a representation of the atmospheric flow. Interactive visualization of geo-spatial data has been widely used in order to facilitate the analysis of NWP models. This paper presents a visualization system for the analysis of spatio-temporal patterns in short-term weather forecasts. For this purpose, we provide an interactive visualization interface that guides users from simple visual overviews to more advanced visualization techniques. Our solution presents multiple views that include a timeline with geo-referenced maps, an integrated webmap view, a forecast operation tool, a curve-pattern selector, spatial filters, and a linked meteogram. Two key contributions of this work are the timeline with geo-referenced maps and the curve-pattern selector. The latter provides novel functionality that allows users to specify and search for meaningful patterns in the data. The visual interface of our solution allows users to detect both possible weather trends and errors in the weather forecast model.We illustrate the usage of our solution with a series of case studies that were designed and validated in collaboration with domain experts.
@article{Diehl-2015-VAS, author = {Diehl, Alexandra and Pelorosso, Leandro and Delrieux, Claudio and Saulo, Celeste and Ruiz, Juan and Gr{\"o}ller, Meister Eduard and Bruckner, Stefan}, journal = {Computer Graphics Forum}, title = {Visual Analysis of Spatio-Temporal Data: Applications in Weather Forecasting}, year = {2015}, month = may, number = {3}, pages = {381--390}, volume = {34}, doi = {10.1111/cgf.12650}, event = {EuroVis 2015}, keywords = {weather forecasting, visual analysis, spatiotemporal data}, location = {Cagliari, Italy}, owner = {bruckner}, timestamp = {2015.06.08}, } -
 Guided Volume Editing based on Histogram DissimilarityAlexey Karimov, Gabriel Mistelbauer, Thomas Auzinger, and Stefan BrucknerComputer Graphics Forum, Cagliari, Italy, May 2015
Segmentation of volumetric data is an important part of many analysis pipelines, but frequently requires manual inspection and correction. While plenty of volume editing techniques exist, it remains cumbersome and error-prone for the user to find and select appropriate regions for editing. We propose an approach to improve volume editing by detecting potential segmentation defects while considering the underlying structure of the object of interest. Our method is based on a novel histogram dissimilarity measure between individual regions, derived from structural information extracted from the initial segmentation. Based on this information, our interactive system guides the user towards potential defects, provides integrated tools for their inspection, and automatically generates suggestions for their resolution. We demonstrate that our approach can reduce interaction effort and supports the user in a comprehensive investigation for high-quality segmentations.
@article{Karimov-2015-GVE, author = {Karimov, Alexey and Mistelbauer, Gabriel and Auzinger, Thomas and Bruckner, Stefan}, journal = {Computer Graphics Forum}, title = {Guided Volume Editing based on Histogram Dissimilarity}, year = {2015}, month = may, number = {3}, pages = {91--100}, volume = {34}, doi = {10.1111/cgf.12621}, event = {EuroVis 2015}, keywords = {medical visualization, segmentation, volume editing, interaction}, location = {Cagliari, Italy}, owner = {bruckner}, timestamp = {2015.06.08}, url = {http://www.cg.tuwien.ac.at/research/publications/2015/karimov-2015-HD/}, } -
 Managing Spatial Selections with Contextual SnapshotsPeter Mindek, Meister Eduard Gröller, and Stefan BrucknerComputer Graphics Forum, Dec 2014
Spatial selections are a ubiquitous concept in visualization. By localizing particular features, they can be analysed and compared in different views. However, the semantics of such selections often depend on specific parameter settings and it can be difficult to reconstruct them without additional information. In this paper, we present the concept of contextual snapshots as an effective means for managing spatial selections in visualized data. The selections are automatically associated with the context in which they have been created. Contextual snapshots can also be used as the basis for interactive integrated and linked views, which enable in-place investigation and comparison of multiple visual representations of data. Our approach is implemented as a flexible toolkit with well-defined interfaces for integration into existing systems. We demonstrate the power and generality of our techniques by applying them to several distinct scenarios such as the visualization of simulation data, the analysis of historical documents and the display of anatomical data.
@article{Mindek-2014-MSS, author = {Mindek, Peter and Gr{\"o}ller, Meister Eduard and Bruckner, Stefan}, journal = {Computer Graphics Forum}, title = {Managing Spatial Selections with Contextual Snapshots}, year = {2014}, month = dec, number = {8}, pages = {132--144}, volume = {33}, doi = {10.1111/cgf.12406}, keywords = {interaction, visual analytics, spatial selections, annotations}, url = {http://www.cg.tuwien.ac.at/downloads/csl/}, } -
 Vessel Visualization using Curved Surface ReformationThomas Auzinger, Gabriel Mistelbauer, Ivan Baclija, Rüdiger Schernthaner, Arnold Köchl, Michael Wimmer, Meister Eduard Gröller, and Stefan BrucknerIEEE Transactions on Visualization and Computer Graphics, Dec 2013
Visualizations of vascular structures are frequently used in radiological investigations to detect and analyze vascular diseases. Obstructions of the blood flow through a vessel are one of the main interests of physicians, and several methods have been proposed to aid the visual assessment of calcifications on vessel walls. Curved Planar Reformation (CPR) is a wide-spread method that is designed for peripheral arteries which exhibit one dominant direction. To analyze the lumen of arbitrarily oriented vessels, Centerline Reformation (CR) has been proposed. Both methods project the vascular structures into 2D image space in order to reconstruct the vessel lumen. In this paper, we propose Curved Surface Reformation (CSR), a technique that computes the vessel lumen fully in 3D. This offers high-quality interactive visualizations of vessel lumina and does not suffer from problems of earlier methods such as ambiguous visibility cues or premature discretization of centerline data. Our method maintains exact visibility information until the final query of the 3D lumina data. We also present feedback from several domain experts.
@article{Auzinger-2013-VVC, author = {Auzinger, Thomas and Mistelbauer, Gabriel and Baclija, Ivan and Schernthaner, R{\"u}diger and K{\"o}chl, Arnold and Wimmer, Michael and Gr{\"o}ller, Meister Eduard and Bruckner, Stefan}, journal = {IEEE Transactions on Visualization and Computer Graphics}, title = {Vessel Visualization using Curved Surface Reformation}, year = {2013}, month = dec, number = {12}, pages = {2858--2867}, volume = {19}, doi = {10.1109/TVCG.2013.215}, event = {IEEE VIS 2013}, keywords = {volume Rendering, reformation, vessel, surface approximation}, url = {http://www.cg.tuwien.ac.at/research/publications/2013/Auzinger_Mistelbauer_2013_CSR/}, } -
 VAICo: Visual Analysis for Image ComparisonJohanna Schmidt, Meister Eduard Gröller, and Stefan BrucknerIEEE Transactions on Visualization and Computer Graphics, Dec 2013
Scientists, engineers, and analysts are confronted with ever larger and more complex sets of data, whose analysis poses special challenges. In many situations it is necessary to compare two or more datasets. Hence there is a need for comparative visualization tools to help analyze differences or similarities among datasets. In this paper an approach for comparative visualization for sets of images is presented. Well-established techniques for comparing images frequently place them side-by-side. A major drawback of such approaches is that they do not scale well. Other image comparison methods encode differences in images by abstract parameters like color. In this case information about the underlying image data gets lost. This paper introduces a new method for visualizing differences and similarities in large sets of images which preserves contextual information, but also allows the detailed analysis of subtle variations. Our approach identifies local changes and applies cluster analysis techniques to embed them in a hierarchy. The results of this process are then presented in an interactive web application which allows users to rapidly explore the space of differences and drill-down on particular features. We demonstrate the flexibility of our approach by applying it to multiple distinct domains.
@article{Schmidt-2013-VVA, author = {Schmidt, Johanna and Gr{\"o}ller, Meister Eduard and Bruckner, Stefan}, journal = {IEEE Transactions on Visualization and Computer Graphics}, title = {VAICo: Visual Analysis for Image Comparison}, year = {2013}, month = dec, number = {12}, pages = {2090--2099}, volume = {19}, doi = {10.1109/TVCG.2013.213}, event = {IEEE VIS 2013}, keywords = {focus+context visualization, image set comparison, comparative visualization}, url = {http://www.cg.tuwien.ac.at/research/publications/2013/schmidt-2013-vaico/}, } -
 Instant Convolution Shadows for Volumetric Detail MappingDaniel Patel, Veronika Šoltészová, Jan Martin Nordbotten, and Stefan BrucknerACM Transactions on Graphics, Sep 2013
In this article, we present a method for rendering dynamic scenes featuring translucent procedural volumetric detail with all-frequency soft shadows being cast from objects residing inside the view frustum. Our approach is based on an approximation of physically correct shadows from distant Gaussian area light sources positioned behind the view plane, using iterative convolution. We present a theoretical and empirical analysis of this model and propose an efficient class of convolution kernels which provide high quality at interactive frame rates. Our GPU-based implementation supports arbitrary volumetric detail maps, requires no precomputation, and therefore allows for real-time modi?cation of all rendering parameters.
@article{Patel-2013-ICS, author = {Patel, Daniel and \v{S}olt{\'e}szov{\'a}, Veronika and Nordbotten, Jan Martin and Bruckner, Stefan}, journal = {ACM Transactions on Graphics}, title = {Instant Convolution Shadows for Volumetric Detail Mapping}, year = {2013}, month = sep, number = {5}, pages = {154:1--154:18}, volume = {32}, doi = {10.1145/2492684}, keywords = {shadows, volumetric effects, procedural texturing, filtering}, project = {geoillustrator}, url = {http://dl.acm.org/citation.cfm?id=2492684}, } -
 Result-Driven Exploration of Simulation Parameter Spaces for Visual Effects DesignStefan Bruckner, and Torsten MöllerIEEE Transactions on Visualization and Computer Graphics, Salt Lake City, Utah, USA, Oct 2010
Graphics artists commonly employ physically-based simulation for the generation of effects such as smoke, explosions, and similar phenomena. The task of finding the correct parameters for a desired result, however, is difficult and time-consuming as current tools provide little to no guidance. In this paper, we present a new approach for the visual exploration of such parameter spaces. Given a three-dimensional scene description, we utilize sampling and spatio-temporal clustering techniques to generate a concise overview of the achievable variations and their temporal evolution. Our visualization system then allows the user to explore the simulation space in a goal-oriented manner. Animation sequences with a set of desired characteristics can be composed using a novel search-by-example approach and interactive direct volume rendering is employed to provide instant visual feedback. A user study was performed to evaluate the applicability of our system in production use.
@article{Bruckner-2010-RES, author = {Bruckner, Stefan and M{\"o}ller, Torsten}, journal = {IEEE Transactions on Visualization and Computer Graphics}, title = {Result-Driven Exploration of Simulation Parameter Spaces for Visual Effects Design}, year = {2010}, month = oct, number = {6}, pages = {1467--1475}, volume = {16}, affiliation = {tuwien}, doi = {10.1109/TVCG.2010.190}, event = {IEEE Visualization 2010}, keywords = {visual exploration, visual effects, clustering, time-dependent volume data}, location = {Salt Lake City, Utah, USA}, url = {http://www.cg.tuwien.ac.at/research/publications/2010/brucker-2010-RES/}, } -
 Isosurface Similarity MapsStefan Bruckner, and Torsten MöllerComputer Graphics Forum, Bordeaux, France, Jun 2010Best Paper Award at EuroVis 2010
In this paper, we introduce the concept of isosurface similarity maps for the visualization of volume data. Isosurface similarity maps present structural information of a volume data set by depicting similarities between individual isosurfaces quantified by a robust information-theoretic measure. Unlike conventional histograms, they are not based on the frequency of isovalues and/or derivatives and therefore provide complementary information. We demonstrate that this new representation can be used to guide transfer function design and visualization parameter specification. Furthermore, we use isosurface similarity to develop an automatic parameter-free method for identifying representative isovalues. Using real-world data sets, we show that isosurface similarity maps can be a useful addition to conventional classification techniques.
@article{Bruckner-2010-ISM, author = {Bruckner, Stefan and M{\"o}ller, Torsten}, title = {Isosurface Similarity Maps}, journal = {Computer Graphics Forum}, year = {2010}, volume = {29}, number = {3}, pages = {773--782}, month = jun, note = {Best Paper Award at EuroVis 2010}, affiliation = {tuwien}, doi = {10.1111/j.1467-8659.2009.01689.x}, event = {EuroVis 2010}, keywords = {isosurfaces, volume visualization, mutual information, histograms}, location = {Bordeaux, France}, url = {http://www.cg.tuwien.ac.at/research/publications/2010/bruckner-2010-ISM/}, } -
 BrainGazer - Visual Queries for Neurobiology ResearchStefan Bruckner, Veronika Šoltészová, Meister Eduard Gröller, Jiří Hladůvka, Katja Bühler, Jai Yu, and Barry DicksonIEEE Transactions on Visualization and Computer Graphics, Atlantic City, New Jersey, USA, Nov 2009
Neurobiology investigates how anatomical and physiological relationships in the nervous system mediate behavior. Molecular genetic techniques, applied to species such as the common fruit fly Drosophila melanogaster, have proven to be an important tool in this research. Large databases of transgenic specimens are being built and need to be analyzed to establish models of neural information processing. In this paper we present an approach for the exploration and analysis of neural circuits based on such a database. We have designed and implemented BrainGazer, a system which integrates visualization techniques for volume data acquired through confocal microscopy as well as annotated anatomical structures with an intuitive approach for accessing the available information. We focus on the ability to visually query the data based on semantic as well as spatial relationships. Additionally, we present visualization techniques for the concurrent depiction of neurobiological volume data and geometric objects which aim to reduce visual clutter. The described system is the result of an ongoing interdisciplinary collaboration between neurobiologists and visualization researchers.
@article{Bruckner-2009-BVQ, author = {Bruckner, Stefan and \v{S}olt{\'e}szov{\'a}, Veronika and Gr{\"o}ller, Meister Eduard and Hlad\r{u}vka, Ji\v{r}{\'i} and B{\"u}hler, Katja and Yu, Jai and Dickson, Barry}, journal = {IEEE Transactions on Visualization and Computer Graphics}, title = {BrainGazer - Visual Queries for Neurobiology Research}, year = {2009}, month = nov, number = {6}, pages = {1497--1504}, volume = {15}, affiliation = {tuwien}, doi = {10.1109/TVCG.2009.121}, event = {IEEE Visualization 2009}, keywords = {biomedical visualization, neurobiology, visual queries, volume visualization}, location = {Atlantic City, New Jersey, USA}, url = {http://www.cg.tuwien.ac.at/research/publications/2009/bruckner-2009-BVQ/}, } -
 Instant Volume Visualization using Maximum Intensity Difference AccumulationStefan Bruckner, and Meister Eduard GröllerComputer Graphics Forum, Berlin, Germany, Jun 2009
It has long been recognized that transfer function setup for Direct Volume Rendering (DVR) is crucial to its usability. However, the task of finding an appropriate transfer function is complex and time-consuming even for experts. Thus, in many practical applications simpler techniques which do not rely on complex transfer functions are employed. One common example is Maximum Intensity Projection (MIP) which depicts the maximum value along each viewing ray. In this paper, we introduce Maximum Intensity Difference Accumulation (MIDA), a new approach which combines the advantages of DVR and MIP. Like MIP, MIDA exploits common data characteristics and hence does not require complex transfer functions to generate good visualization results. It does, however, feature occlusion and shape cues similar to DVR. Furthermore, we show that MIDA - in addition to being a useful technique in its own right- can be used to smoothly transition between DVR and MIP in an intuitive manner. MIDA can be easily implemented using volume raycasting and achieves real-time performance on current graphics hardware.
@article{Bruckner-2009-IVV, author = {Bruckner, Stefan and Gr{\"o}ller, Meister Eduard}, journal = {Computer Graphics Forum}, title = {Instant Volume Visualization using Maximum Intensity Difference Accumulation}, year = {2009}, issn = {0167-7055}, month = jun, number = {3}, pages = {775--782}, volume = {28}, affiliation = {tuwien}, doi = {10.1111/j.1467-8659.2009.01474.x}, event = {EuroVis 2009}, keywords = {illustrative visualization, maximum intensity projection, direct volume rendering}, location = {Berlin, Germany}, url = {http://www.cg.tuwien.ac.at/research/publications/2009/bruckner-2009-IVV/}, } -
 Enhancing Depth-Perception with Flexible Volumetric HalosStefan Bruckner, and Meister Eduard GröllerIEEE Transactions on Visualization and Computer Graphics, Sacramento, California, USA, Oct 2007
Volumetric data commonly has high depth complexity which makes it difficult to judge spatial relationships accurately. There are many different ways to enhance depth perception, such as shading, contours, and shadows. Artists and illustrators frequently employ halos for this purpose. In this technique, regions surrounding the edges of certain structures are darkened or brightened which makes it easier to judge occlusion. Based on this concept, we present a flexible method for enhancing and highlighting structures of interest using GPU-based direct volume rendering. Our approach uses an interactively defined halo transfer function to classify structures of interest based on data value, direction, and position. A feature-preserving spreading algorithm is applied to distribute seed values to neighboring locations, generating a controllably smooth field of halo intensities. These halo intensities are then mapped to colors and opacities using a halo profile function. Our method can be used to annotate features at interactive frame rates.
@article{Bruckner-2007-EDF, author = {Bruckner, Stefan and Gr{\"o}ller, Meister Eduard}, journal = {IEEE Transactions on Visualization and Computer Graphics}, title = {Enhancing Depth-Perception with Flexible Volumetric Halos}, year = {2007}, month = oct, number = {6}, pages = {1344--1351}, volume = {13}, affiliation = {tuwien}, doi = {10.1109/TVCG.2007.70555}, event = {IEEE Visualization 2007}, keywords = {volume rendering, illustrative visualization, halos}, location = {Sacramento, California, USA}, url = {http://www.cg.tuwien.ac.at/research/publications/2007/bruckner-2007-EDF/}, } -
 Style Transfer Functions for Illustrative Volume RenderingStefan Bruckner, and Meister Eduard GröllerComputer Graphics Forum, Prague, Czech Republic, Sep 20073rd Best Paper Award at Eurographics 2007
Illustrative volume visualization frequently employs non-photorealistic rendering techniques to enhance important features or to suppress unwanted details. However, it is difficult to integrate multiple non-photorealistic rendering approaches into a single framework due to great differences in the individual methods and their parameters. In this paper, we present the concept of style transfer functions. Our approach enables flexible data-driven illumination which goes beyond using the transfer function to just assign colors and opacities. An image-based lighting model uses sphere maps to represent non-photorealistic rendering styles. Style transfer functions allow us to combine a multitude of different shading styles in a single rendering. We extend this concept with a technique for curvature-controlled style contours and an illustrative transparency model. Our implementation of the presented methods allows interactive generation of high-quality volumetric illustrations.
@article{Bruckner-2007-STF, author = {Bruckner, Stefan and Gr{\"o}ller, Meister Eduard}, journal = {Computer Graphics Forum}, title = {Style Transfer Functions for Illustrative Volume Rendering}, year = {2007}, month = sep, note = {3rd Best Paper Award at Eurographics 2007}, number = {3}, pages = {715--724}, volume = {26}, affiliation = {tuwien}, doi = {10.1111/j.1467-8659.2007.01095.x}, event = {Eurographics 2007}, keywords = {illustrative visualization, transfer functions, volume rendering}, location = {Prague, Czech Republic}, url = {http://www.cg.tuwien.ac.at/research/publications/2007/bruckner-2007-STF/}, } -
 Illustrative Context-Preserving Exploration of Volume DataStefan Bruckner, Sören Grimm, Armin Kanitsar, and Meister Eduard GröllerIEEE Transactions on Visualization and Computer Graphics, Nov 2006
In volume rendering it is very difficult to simultaneously visualize interior and exterior structures while preserving clear shape cues. Highly transparent transfer functions produce cluttered images with many overlapping structures, while clipping techniques completely remove possibly important context information. In this paper we present a new model for volume rendering, inspired by techniques from illustration. It provides a means of interactively inspecting the interior of a volumetric data set in a feature-driven way which retains context information. The context-preserving volume rendering model uses a function of shading intensity, gradient magnitude, distance to the eye point, and previously accumulated opacity to selectively reduce the opacity in less important data regions. It is controlled by two user-specified parameters. This new method represents an alternative to conventional clipping techniques, shares their easy and intuitive user control, but does not suffer from the drawback of missing context information.
@article{Bruckner-2006-ICE, author = {Bruckner, Stefan and Grimm, S{\"o}ren and Kanitsar, Armin and Gr{\"o}ller, Meister Eduard}, journal = {IEEE Transactions on Visualization and Computer Graphics}, title = {Illustrative Context-Preserving Exploration of Volume Data}, year = {2006}, issn = {1077-2626}, month = nov, number = {6}, pages = {1559--1569}, volume = {12}, affiliation = {tuwien}, doi = {10.1109/TVCG.2006.96}, keywords = {focus+context techniques, volume rendering, illustrative visualization}, url = {http://www.cg.tuwien.ac.at/research/publications/2006/bruckner-2006-ICE/}, } -
 Exploded Views for Volume DataStefan Bruckner, and Meister Eduard GröllerIEEE Transactions on Visualization and Computer Graphics, Sep 2006
Exploded views are an illustration technique where an object is partitioned into several segments. These segments are displaced to reveal otherwise hidden detail. In this paper we apply the concept of exploded views to volumetric data in order to solve the general problem of occlusion. In many cases an object of interest is occluded by other structures. While transparency or cutaways can be used to reveal a focus object, these techniques remove parts of the context information. Exploded views, on the other hand, do not suffer from this drawback. Our approach employs a force-based model: the volume is divided into a part configuration controlled by a number of forces and constraints. The focus object exerts an explosion force causing the parts to arrange according to the given constraints. We show that this novel and flexible approach allows for a wide variety of explosion-based visualizations including view-dependent explosions. Furthermore, we present a high-quality GPU-based volume ray casting algorithm for exploded views which allows rendering and interaction at several frames per second.
@article{Bruckner-2006-EVV, author = {Bruckner, Stefan and Gr{\"o}ller, Meister Eduard}, journal = {IEEE Transactions on Visualization and Computer Graphics}, title = {Exploded Views for Volume Data}, year = {2006}, issn = {1077-2626}, month = sep, number = {5}, pages = {1077--1084}, volume = {12}, affiliation = {tuwien}, doi = {10.1109/TVCG.2006.140}, event = {IEEE Visualization 2006}, keywords = {exploded views, illustrative visualization, volume rendering}, url = {http://www.cg.tuwien.ac.at/research/publications/2006/bruckner-2006-EVV/}, } -
 VolumeShop: An Interactive System for Direct Volume IllustrationStefan Bruckner, and Meister Eduard GröllerIn Proceedings of IEEE Visualization, Minneapolis, USA, Oct 2005
Illustrations play a major role in the education process. Whether used to teach a surgical or radiologic procedure, to illustrate normal or aberrant anatomy, or to explain the functioning of a technical device, illustration significantly impacts learning. Although many specimens are readily available as volumetric data sets, particularly in medicine, illustrations are commonly produced manually as static images in a time-consuming process. Our goal is to create a fully dynamic three-dimensional illustration environment which directly operates on volume data. Single images have the aesthetic appeal of traditional illustrations, but can be interactively altered and explored. In this paper we present methods to realize such a system which combines artistic visual styles and expressive visualization techniques. We introduce a novel concept for direct multi-object volume visualization which allows control of the appearance of inter-penetrating objects via two-dimensional transfer functions. Furthermore, a unifying approach to efficiently integrate many non-photorealistic rendering models is presented. We discuss several illustrative concepts which can be realized by combining cutaways, ghosting, and selective deformation. Finally, we also propose a simple interface to specify objects of interest through three-dimensional volumetric painting. All presented methods are integrated into VolumeShop, an interactive hardware-accelerated application for direct volume illustration.
@inproceedings{Bruckner-2005-VIS,
  author = {Bruckner, Stefan and Gr{\"o}ller, Meister Eduard},
  booktitle = {Proceedings of IEEE Visualization},
  title = {VolumeShop: An Interactive System for Direct Volume Illustration},
  year = {2005},
  editor = {C. T. Silva, E. Gr{\"o}ller, H. Rushmeier},
  month = oct,
  pages = {671--678},
  affiliation = {tuwien},
  doi = {10.1109/VISUAL.2005.1532856},
  isbn = {0780394623},
  keywords = {focus+context techniques, illustrative visualization, volume rendering},
  location = {Minneapolis, USA},
  url = {http://www.cg.tuwien.ac.at/research/publications/2005/bruckner-2005-VIS/},
}